Histogram
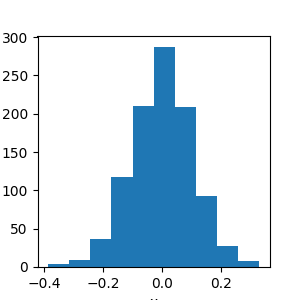
Example histogram.
import matplotlib.pyplot as plt
import numpy as np

# Initialize a figure and axes object
fig, ax = plt.subplots(figsize=(3,3))

# Data
x = np.random.normal(0, 0.1, 1000)

# Add data a scatter points onto axes
ax.hist(x)

# add x labels
ax.set_xlabel("x")

# Show figure.
fig.show()
Total running time of the script: ( 0 minutes 0.048 seconds)