Plotting Packages
The Python visualization landscape is fairly diverse. We’ll list a few of the major plotting packages here:
- Matplotlib — Python’s most used plotting library.
- Seaborn — Statistical plotting functions and better matplotlib aesthetics.
- Pandas.plot — Declarative plotting directly from a Pandas DataFrame.
- Altair — Declarative plotting powered by Vega.
- pdvega — Vega-lite plots from Pandas DataFrames.
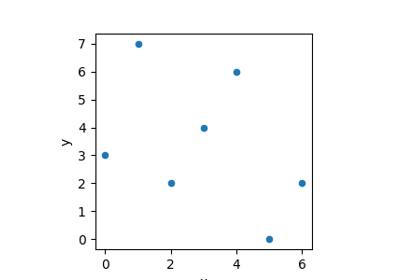
Matplotlib
Matplotlib is a Python 2D plotting library which produces publication quality figures in a variety of hardcopy formats and interactive environments across platforms. Matplotlib can be used in Python scripts, the Python and IPython shells, the Jupyter notebook, web application servers, and four graphical user interface toolkits.
Why all the negativity around Matplotlib?
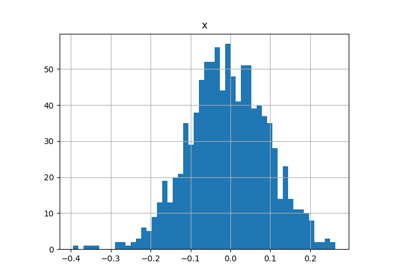
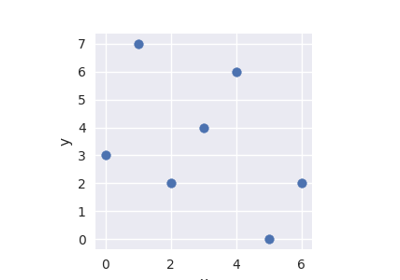
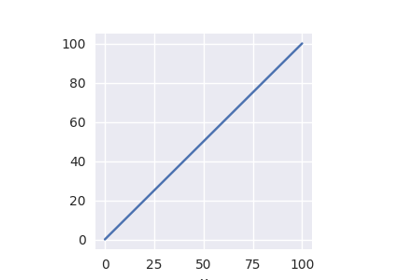
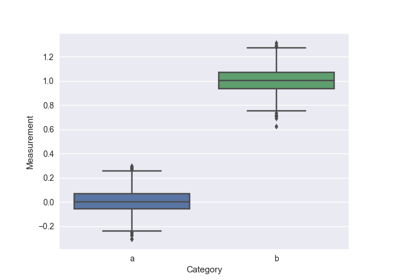
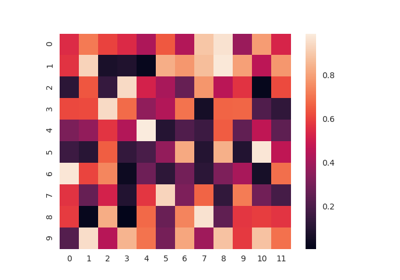
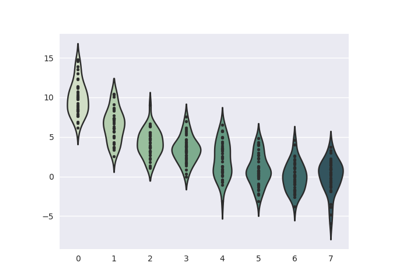
Seaborn
Seaborn is a library for making attractive and informative statistical graphics in Python. It is built on top of matplotlib and tightly integrated with the PyData stack, including support for numpy and pandas data structures and statistical routines from scipy and statsmodels.
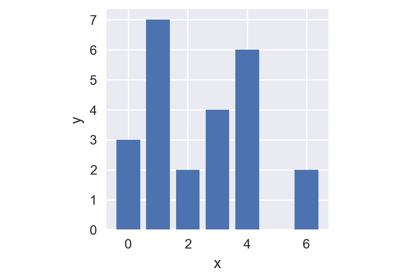
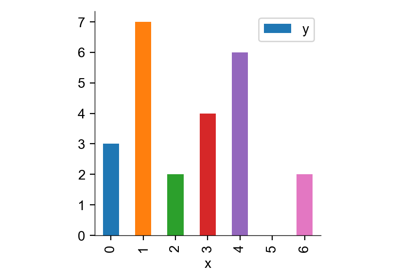
Pandas.plot
Pandas provides a ggplot like API for creating plots from Pandas DataFrames. This module is built on top of Matplotlib.