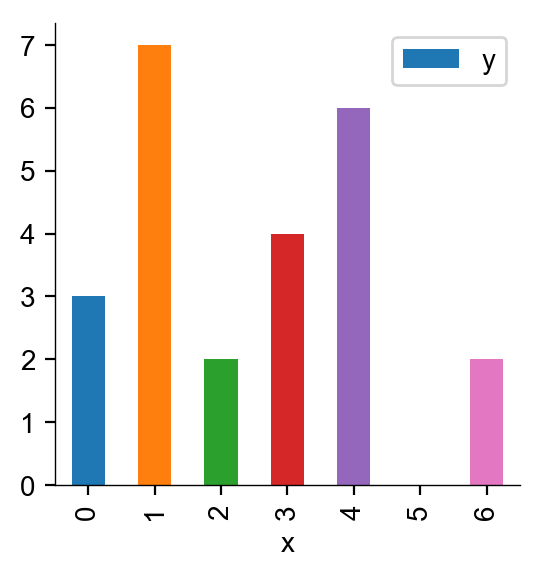
Bar Chart
Example bar chart.
import matplotlib.pyplot as plt
import pandas as pd

# Initialize a figure and axes object
fig, ax = plt.subplots(figsize=(3,3))

# Data
df = pd.DataFrame({
    'x': [0, 1, 2, 3, 4, 5, 6],
    'y': [3, 7, 2, 4, 6, 0, 2]

})

# Plot data.
df.plot.bar(
    x='x',
    y='y',
    ax=ax
)
Total running time of the script: ( 0 minutes 0.219 seconds)