Bar Chart
Example bar chart.
import matplotlib.pyplot as plt
import seaborn as sns
sns.set()
# Initialize a figure and axes object
fig, ax = plt.subplots(figsize=(3,3))
# Data
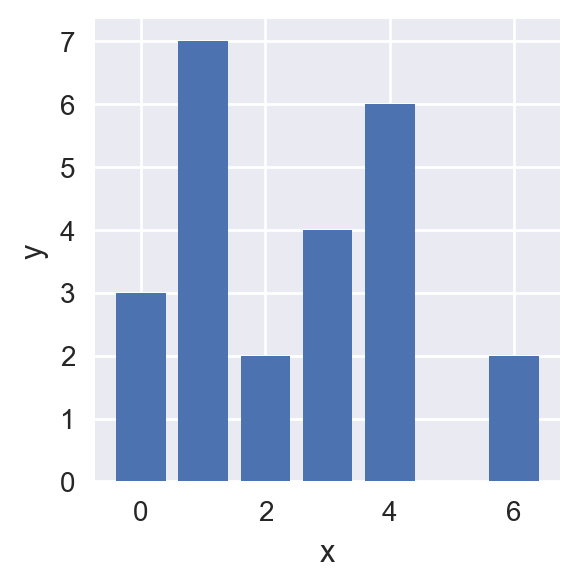
x = [0, 1, 2, 3, 4, 5, 6]
y = [3, 7, 2, 4, 6, 0, 2]
# Add data a scatter points onto axes
ax.bar(x, y)
# Name axes
ax.set_xlabel('x')
ax.set_ylabel('y')
# Show figure.
fig.show()
Total running time of the script: ( 0 minutes 0.707 seconds)