Violin Plot
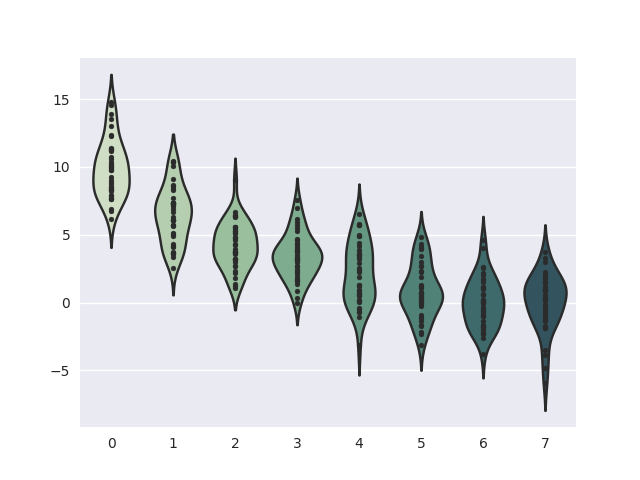
Example Violin Plot
import numpy as np
import seaborn as sns

sns.set()

# Create a random dataset across several variables
rs = np.random.RandomState(0)
n, p = 40, 8
d = rs.normal(0, 2, (n, p))
d += np.log(np.arange(1, p + 1)) * -5 + 10

# Use cubehelix to get a custom sequential palette
pal = sns.cubehelix_palette(p, rot=-.5, dark=.3)

# Show each distribution with both violins and points
sns.violinplot(data=d, palette=pal, inner="points");
Total running time of the script: ( 0 minutes 0.101 seconds)